How I Predict the NZ Real Estate Market (2025/2026)

After almost 20 years in real estate (I started just before the GFC in 2007), one lesson stands out: the housing market isn’t random. It moves in cycles. When you know what to watch, you can make calm, reasoned decisions instead of reacting to headlines.
This article breaks the market into four simple “seasons,” outlines the five variables I track, gives a quick NZ timeline for context, and shares my view for 2025–2026—plus practical steps you can use right now.
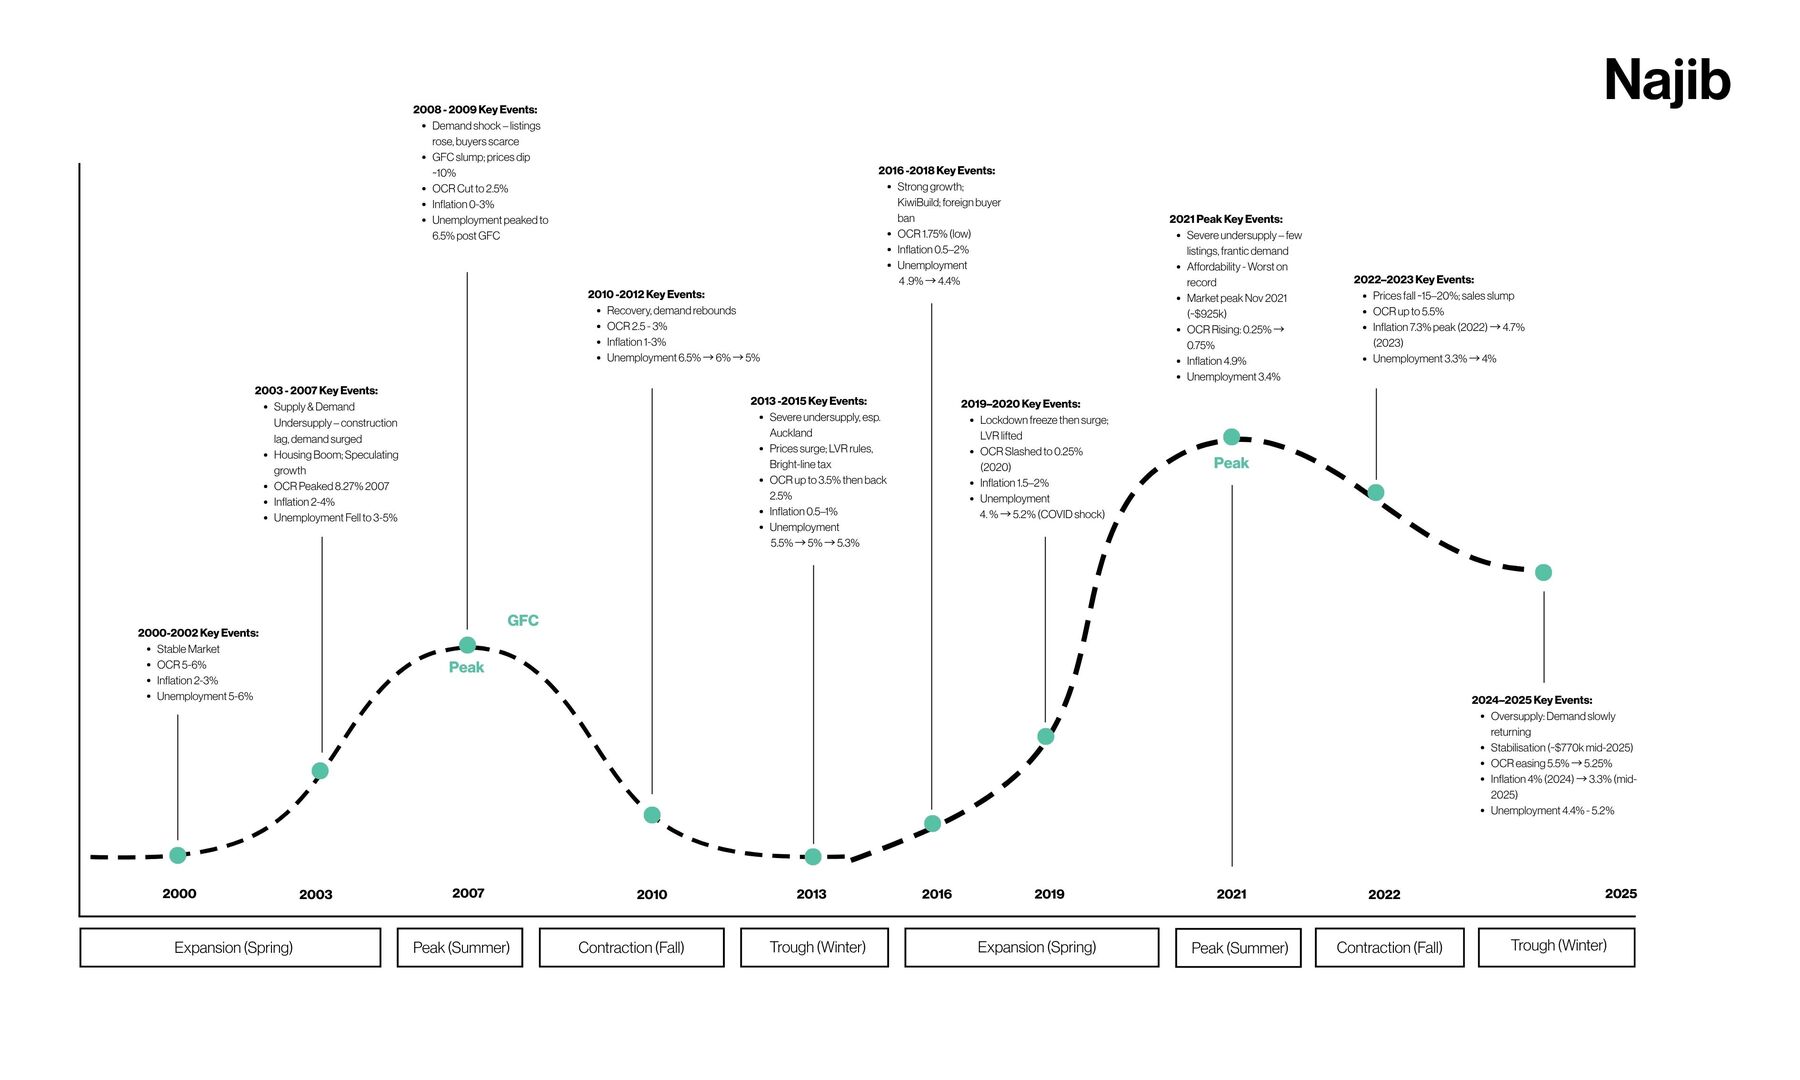
Think of the market like seasons. Each has recognisable signs:
Spring / Expansion
Summer / Peak
Autumn / Contraction
Winter / Trough
Track these five and you’ll understand where the market is heading:
Home Prices (Annual Median)
Healthy growth: ~2–4% p.a.
Well above that = overheating risk; flat/negative = contraction signals.
Number of Annual Sales
Sales volume = demand signal.
Strong demand + limited supply → upward price pressure.
Weak demand → cooling market.
Supply / Inventory
Supply and demand move prices.
Low inventory + demand → prices jump.
High inventory + weak demand → flat or falling prices.
Mortgage Rates
The “puppet master” of affordability and activity.
A ~4.5–5.5% mortgage rate range is broadly balanced in my framework.
Affordability (Inflation + Unemployment)
Sustainable growth prefers inflation under ~2% and unemployment under ~5%.
High inflation erodes buying power; high unemployment reduces buyer demand.
Important: These variables interact. For example, low rates can lift demand, which—if inventory is tight—can push prices beyond the “healthy” range. Always read them together.
The Reserve Bank’s Official Cash Rate (OCR) is a core lever.
Cut OCR → cheaper mortgages, more activity.
Raise OCR → more expensive borrowing, cooler activity.
Policy is often lagged relative to what’s happening on the ground. By the time rates change, the market may already be shifting—so keep watching the other variables, not just OCR headlines.
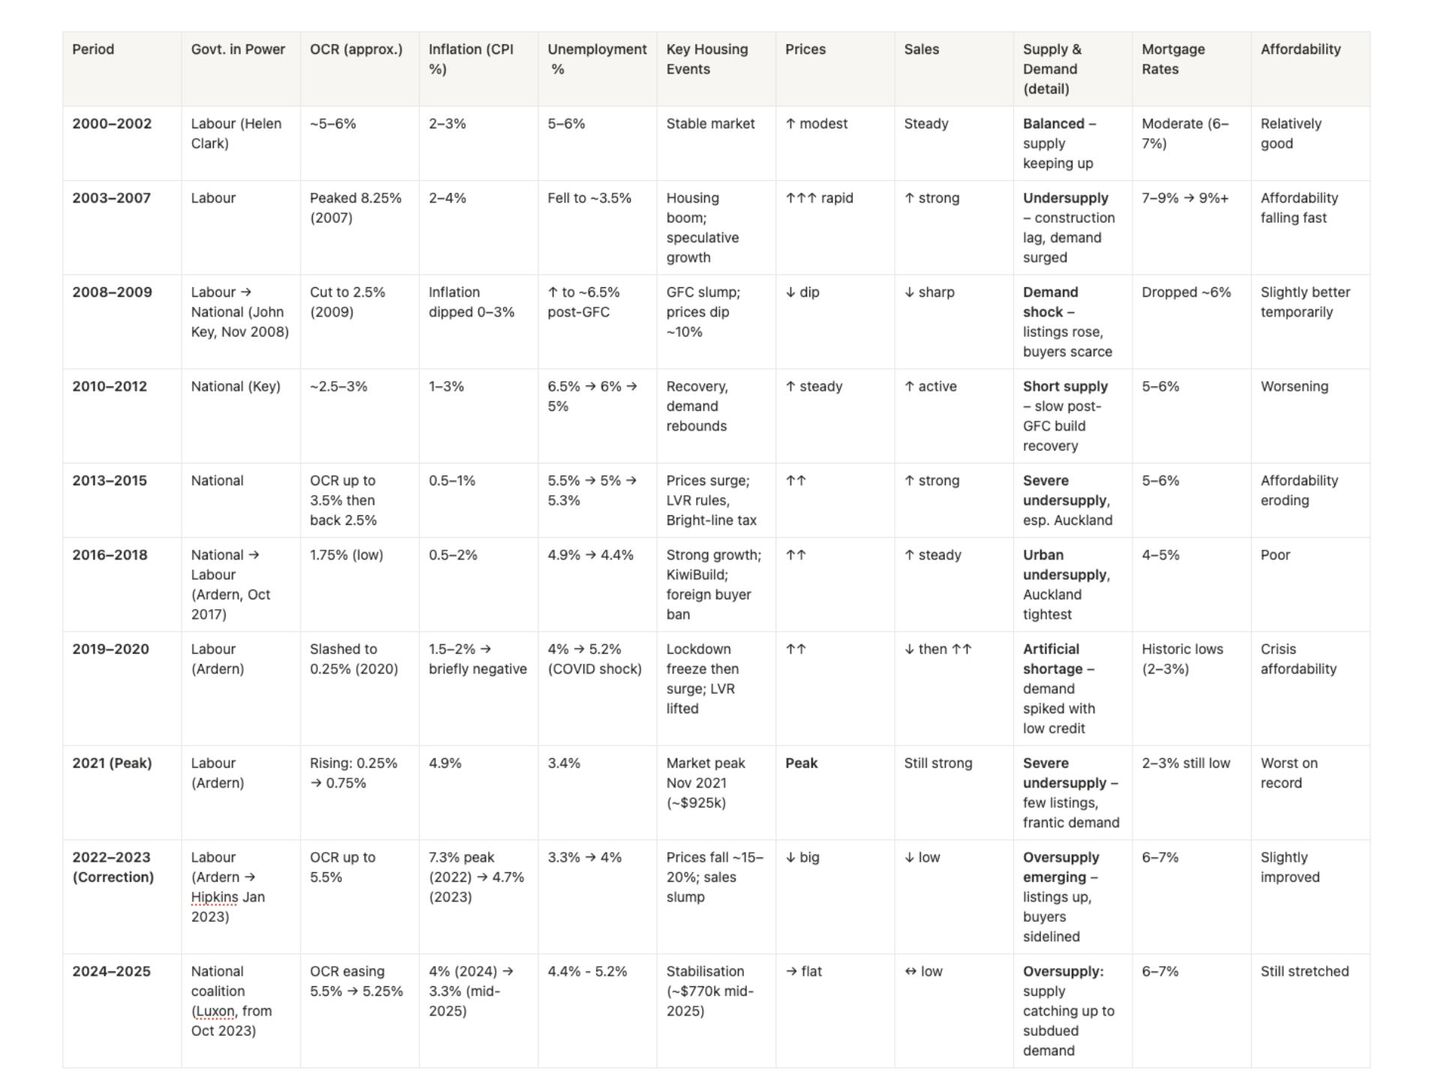
Early 2000s: OCR ~5–6%, inflation 2–3% → relatively stable market.
2003–2007: Supply lagged demand → housing boom; OCR peaked ~8.27% to cool it.
2007–2009 (GFC): Peak then sharp contraction; OCR cut to ~2.5% to stimulate.
2010–2012: Stabilisation; OCR 2.5–3%, low inflation, unemployment elevated post-GFC.
2011: Christchurch earthquake → rebuild uplift; Canterbury diverged in parts.
2016–2018: Policy change + low OCR (~1.75% by 2017) → steady growth.
2019–2020 (COVID-19): Activity dip then major stimulus; near-zero OCR, QE.
2020–2021: Cheap money → boom; prices surged into 2021–early 2022.
2022 onward: Rates rose to fight inflation → contraction then trough.
Buyers
Sellers
Everyone