For anyone watching the New Zealand property market and wondering what comes next, 2026 feels like a confusing year. Prices aren’t exploding like they did in 2021. They’re not collapsing either. Buyers are active, but cautious. Sellers are realistic, but not desperate.
So what’s really happening and what does it mean if you’re thinking about buying, selling, or investing?
The short answer is this: 2026 is shaping up as a stabilising year, not a boom year and not a crash year. And once you understand the numbers behind the headlines, the market starts to make a lot more sense.
The New Zealand housing market is no longer operating at the fever pitch of 2021–2022. That period was defined by ultra-low interest rates, tight supply, and buyers competing aggressively. Prices surged well beyond income growth, and affordability stretched to historic extremes.
Since then, conditions have changed. Price growth has cooled, sales volumes have normalised, supply has increased, and interest rates have done their job of slowing demand. That doesn’t mean the market has stalled it means it has reset into a more balanced phase.
Many people still ask whether prices could fall further from here “will nz house prices crash” The data suggests that while some pockets may soften, the broad market has already absorbed the biggest adjustment. What we’re seeing now is not freefall, but consolidation.
Rather than guessing or relying on sentiment, I always come back to the same five variables. When these are viewed together, they tell a far clearer story than any single headline ever could.
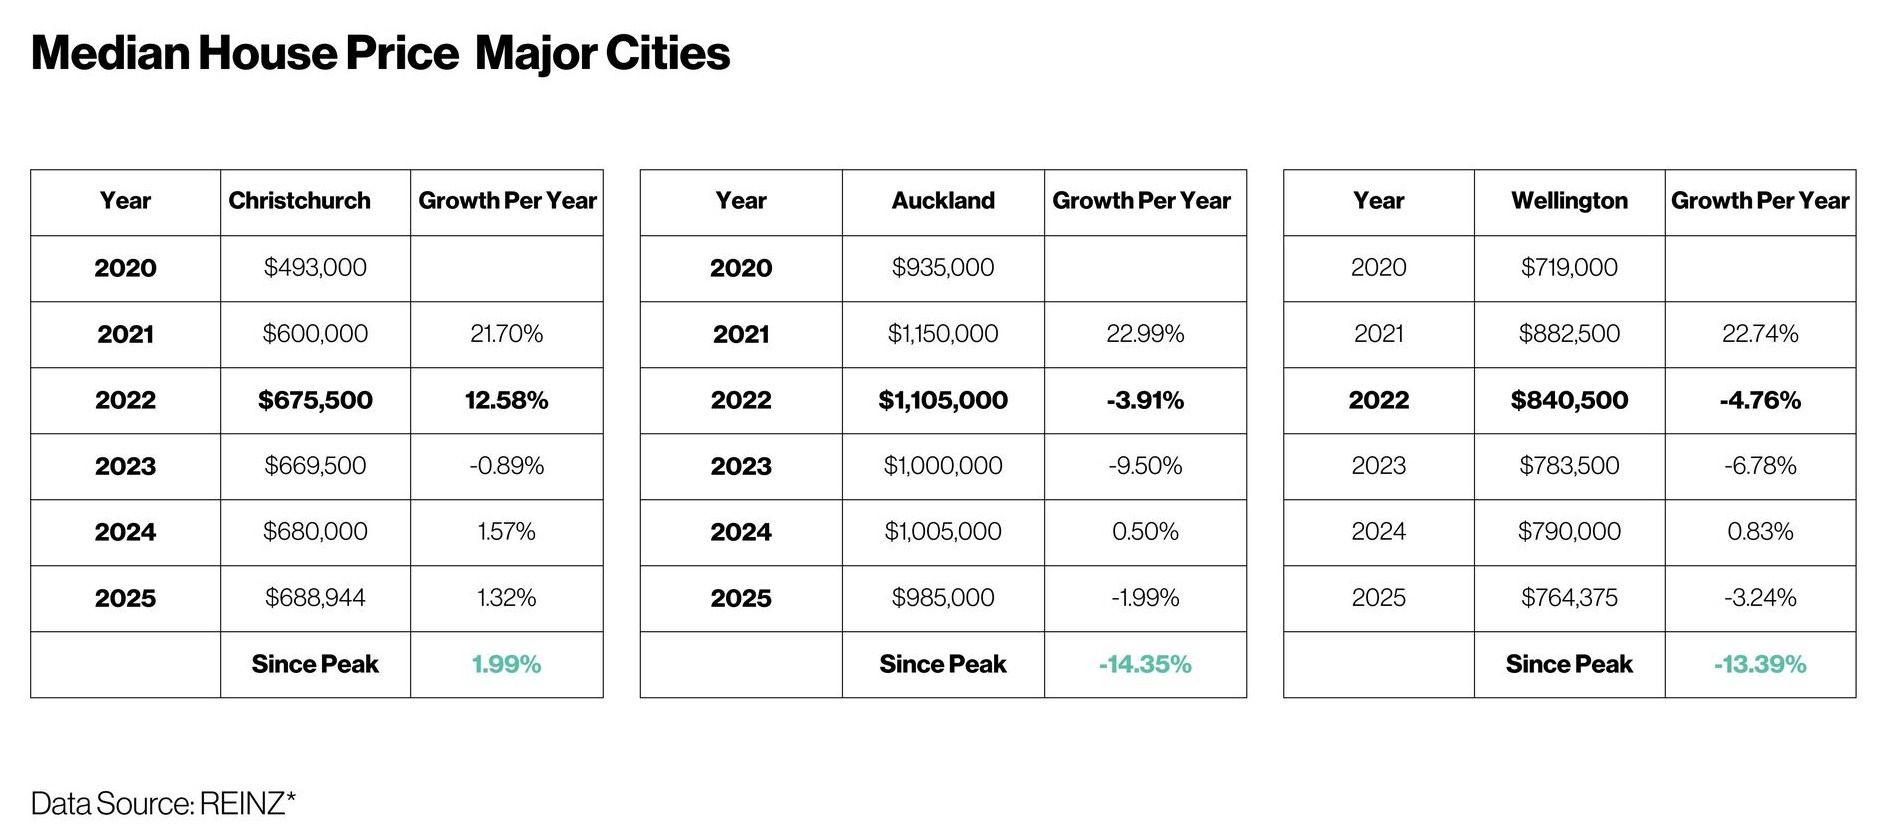
The first is median house prices, which surged sharply through 2020–2021 before flattening and pulling back. Since the peak, prices have moved sideways with modest declines in some regions and stabilisation in others.

When the market is broken down by housing type, an important pattern emerges. Townhouses and standalone residential homes have not moved through the cycle in the same way — and they rarely do.
This is also why I’ve consistently been cautious about investors defaulting to townhouses as a “safe” or “easy” option. While townhouses can look attractive on price and entry level, their long-term growth and return profile is often slower, especially when supply ramps up.
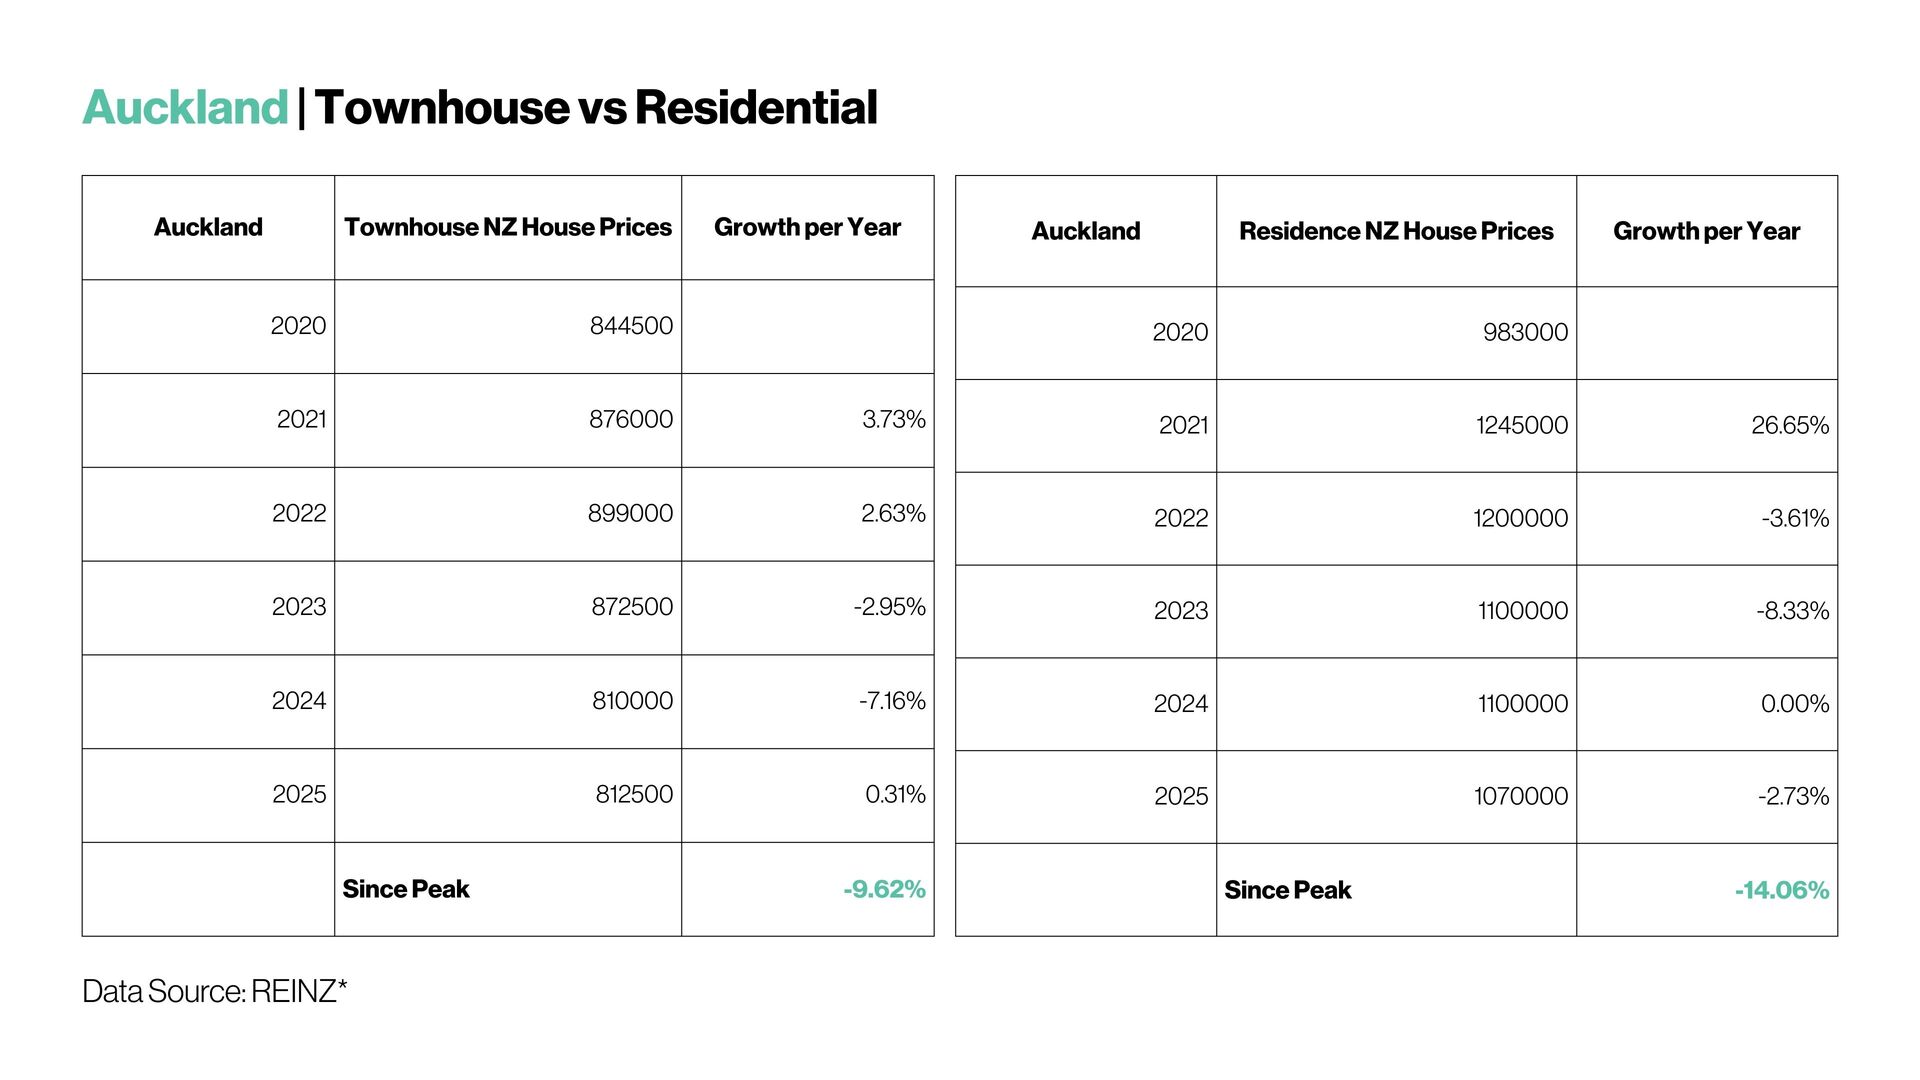
Across Auckland, townhouses saw much smaller gains during the boom years and have experienced a gentler decline since the peak, sitting around 9–10% below peak levels. Standalone houses surged far more aggressively during 2021 and have since corrected more sharply, remaining roughly 14% below peak. That tells us two things at once: houses capture more upside during strong markets, but they also wear more downside when conditions tighten.
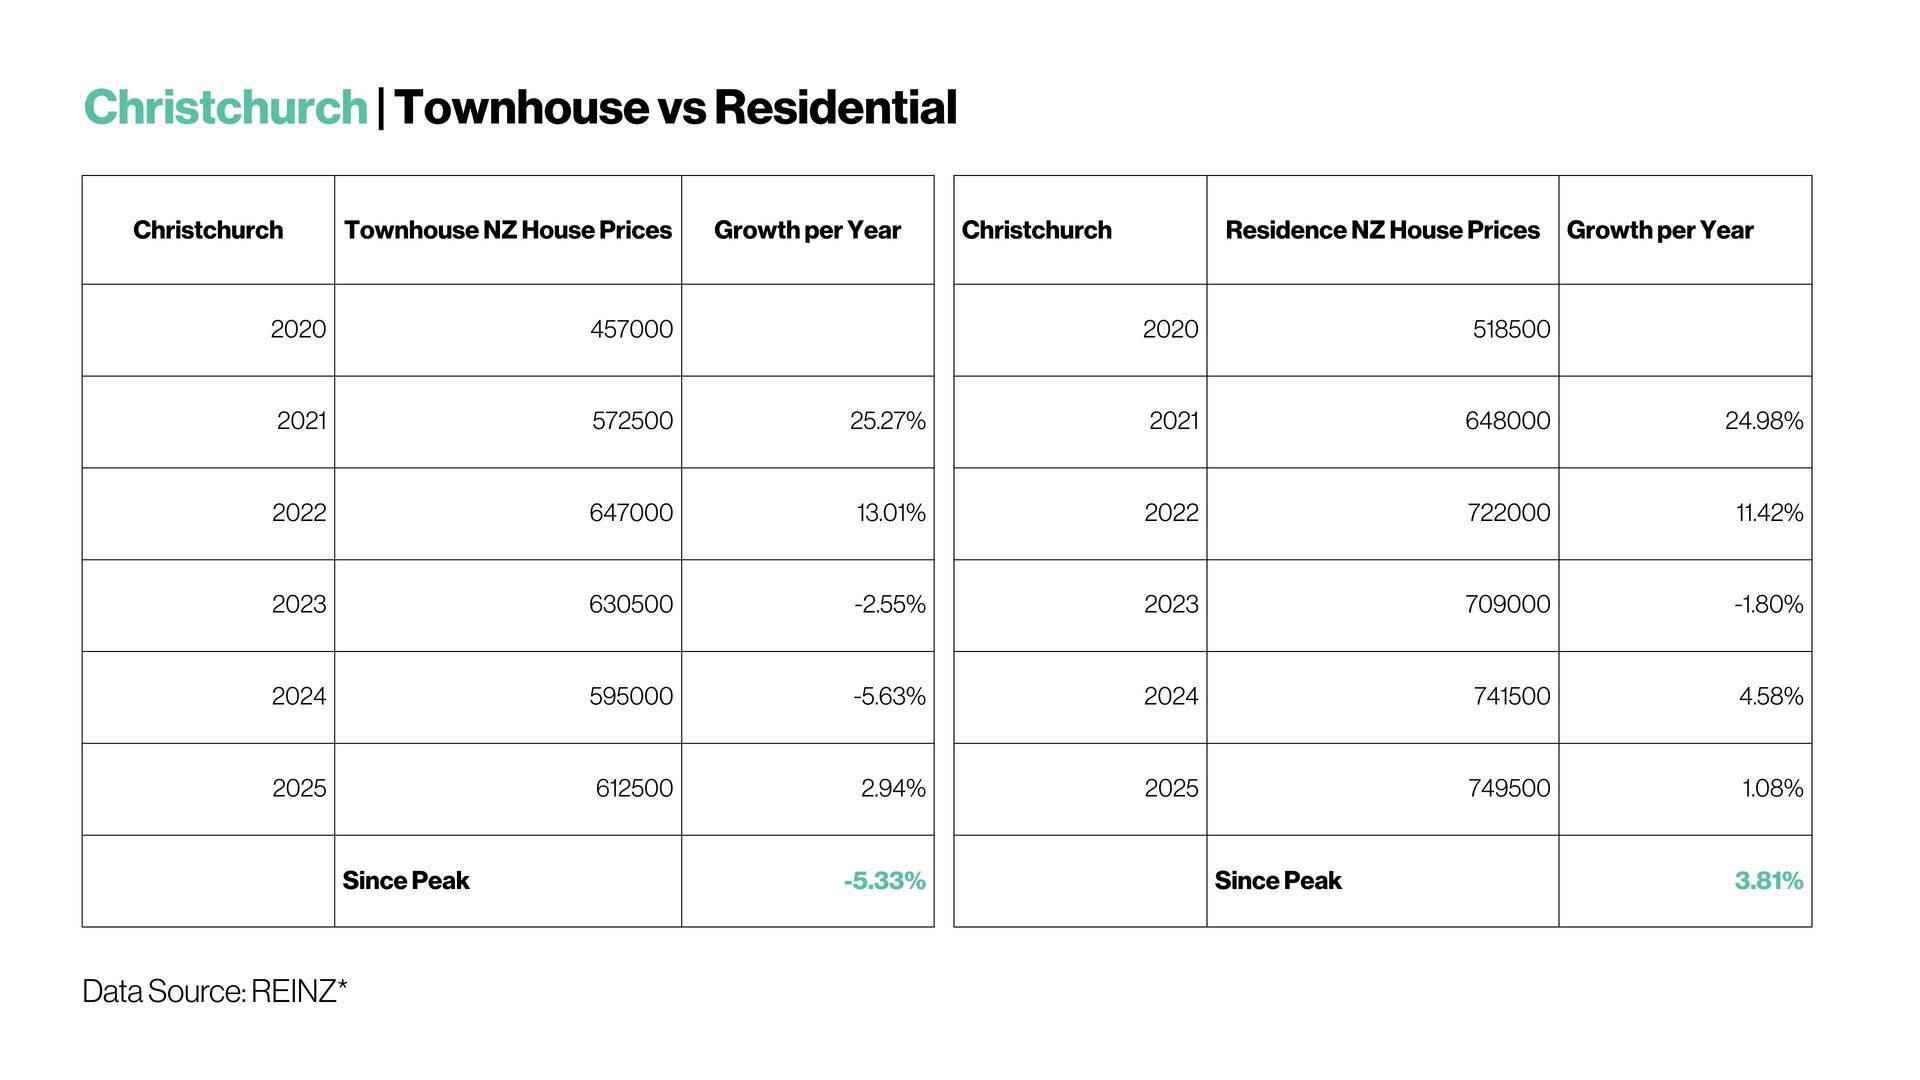
In Christchurch, the contrast is even more telling. Townhouse prices remain slightly below their peak, while standalone residential homes have already moved back above peak levels. This matters because Christchurch has seen a significant pipeline of new townhouse developments. When supply increases faster than owner-occupier demand, growth slows — and returns flatten. Houses, by contrast, benefit from land scarcity, family demand, and longer holding horizons.
This is exactly what I’ve spoken about previously in depth when discussing the so-called “townhouse trap”. When too many near-identical townhouses hit the market at the same time, investors are no longer competing on scarcity they’re competing on price. That compresses capital growth and often drags on long-term ROI, even if rental demand looks solid on paper.

Wellington reinforces the same lesson. Both townhouses and standalone homes remain well below peak, with declines of around 13–15%, reflecting weaker demand, employment uncertainty, and affordability pressure. But again, the lack of land scarcity and oversupply in certain townhouse pockets has amplified the downside.
What these figures show is that not all housing behaves the same. Standalone homes tend to amplify cycles rising faster in booms and recovering more strongly over time. Townhouses, particularly in markets with heavy new supply like parts of Christchurch, tend to move more slowly and are far more sensitive to oversupply and investor sentiment.
That doesn’t mean townhouses are “bad” assets but it does mean they require much more discipline, sharper buying, and realistic expectations. For long-term investors focused on capital growth and resilience across cycles, land still matters.
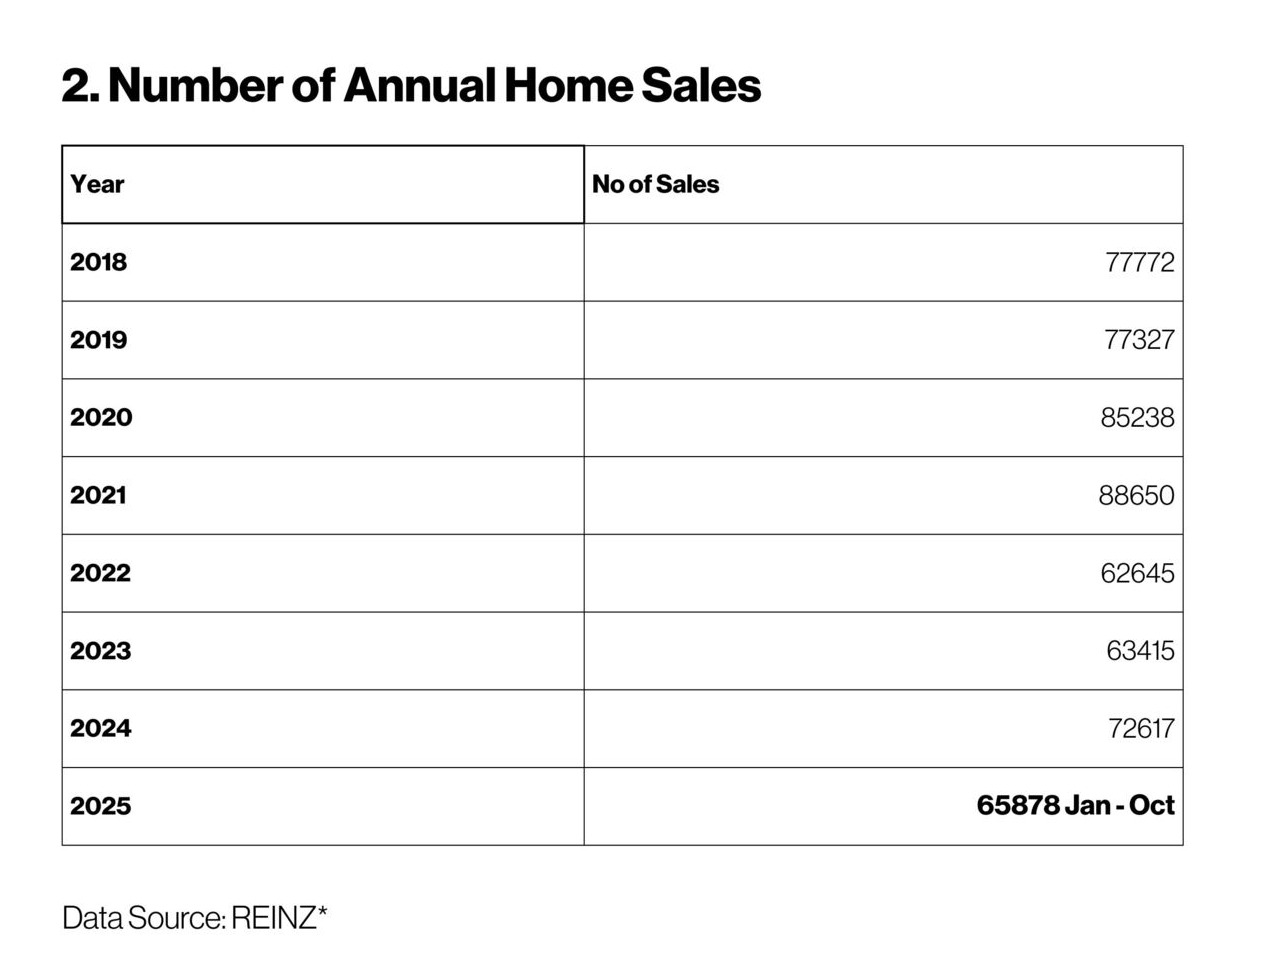
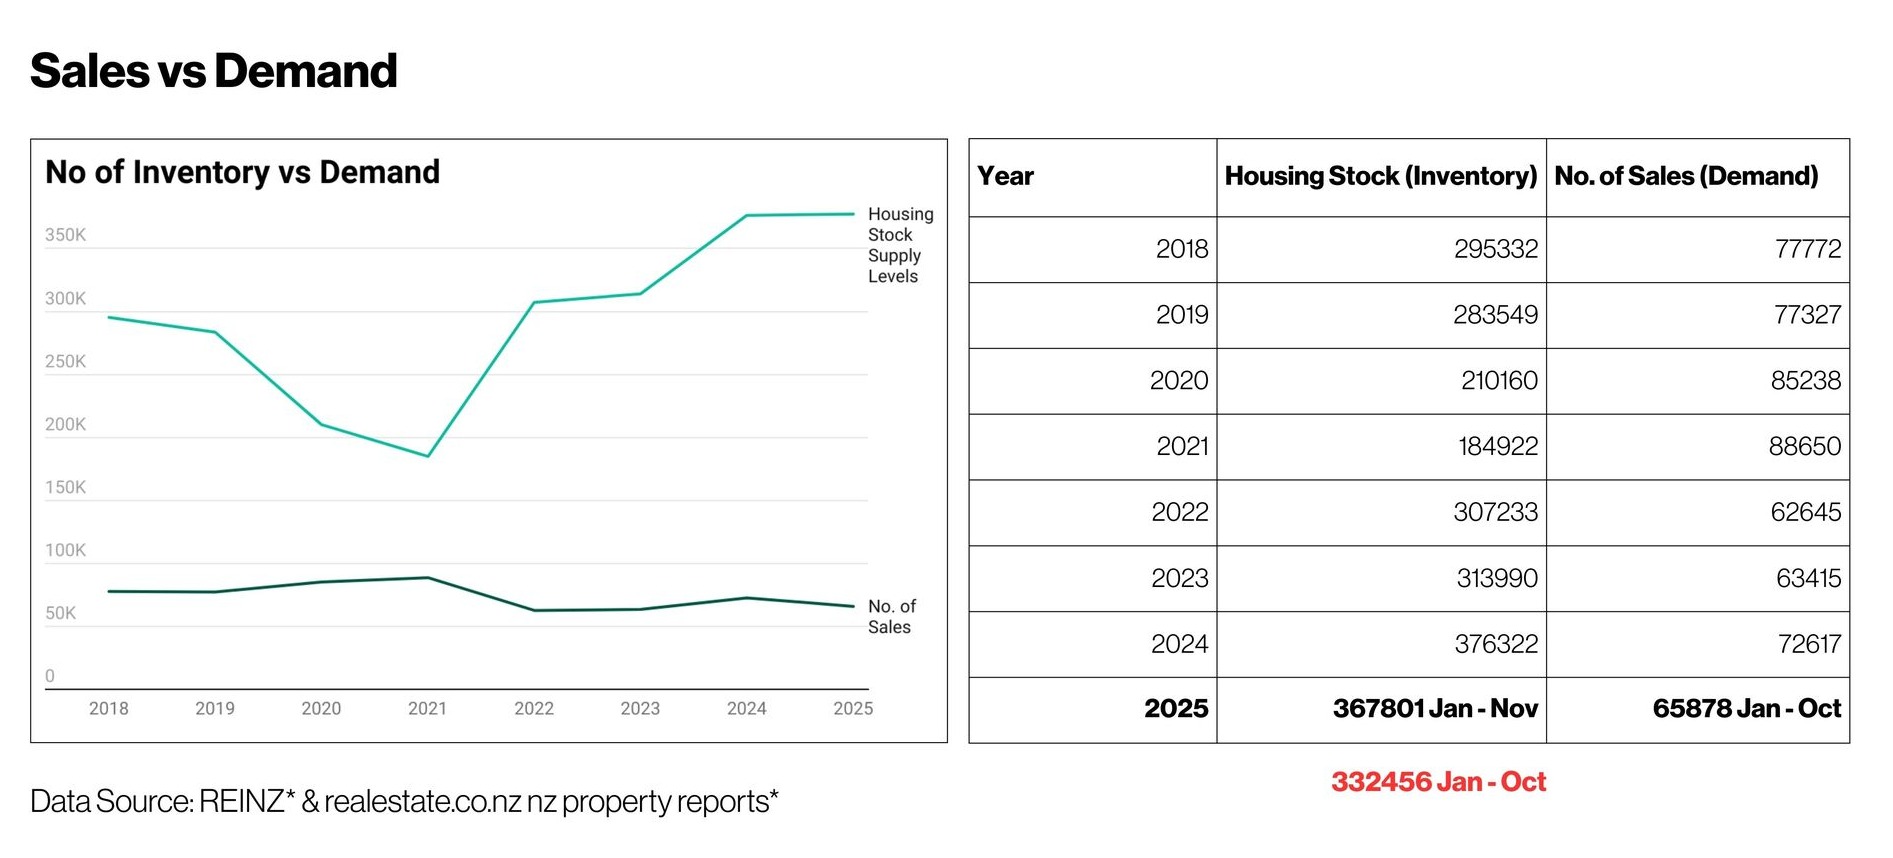
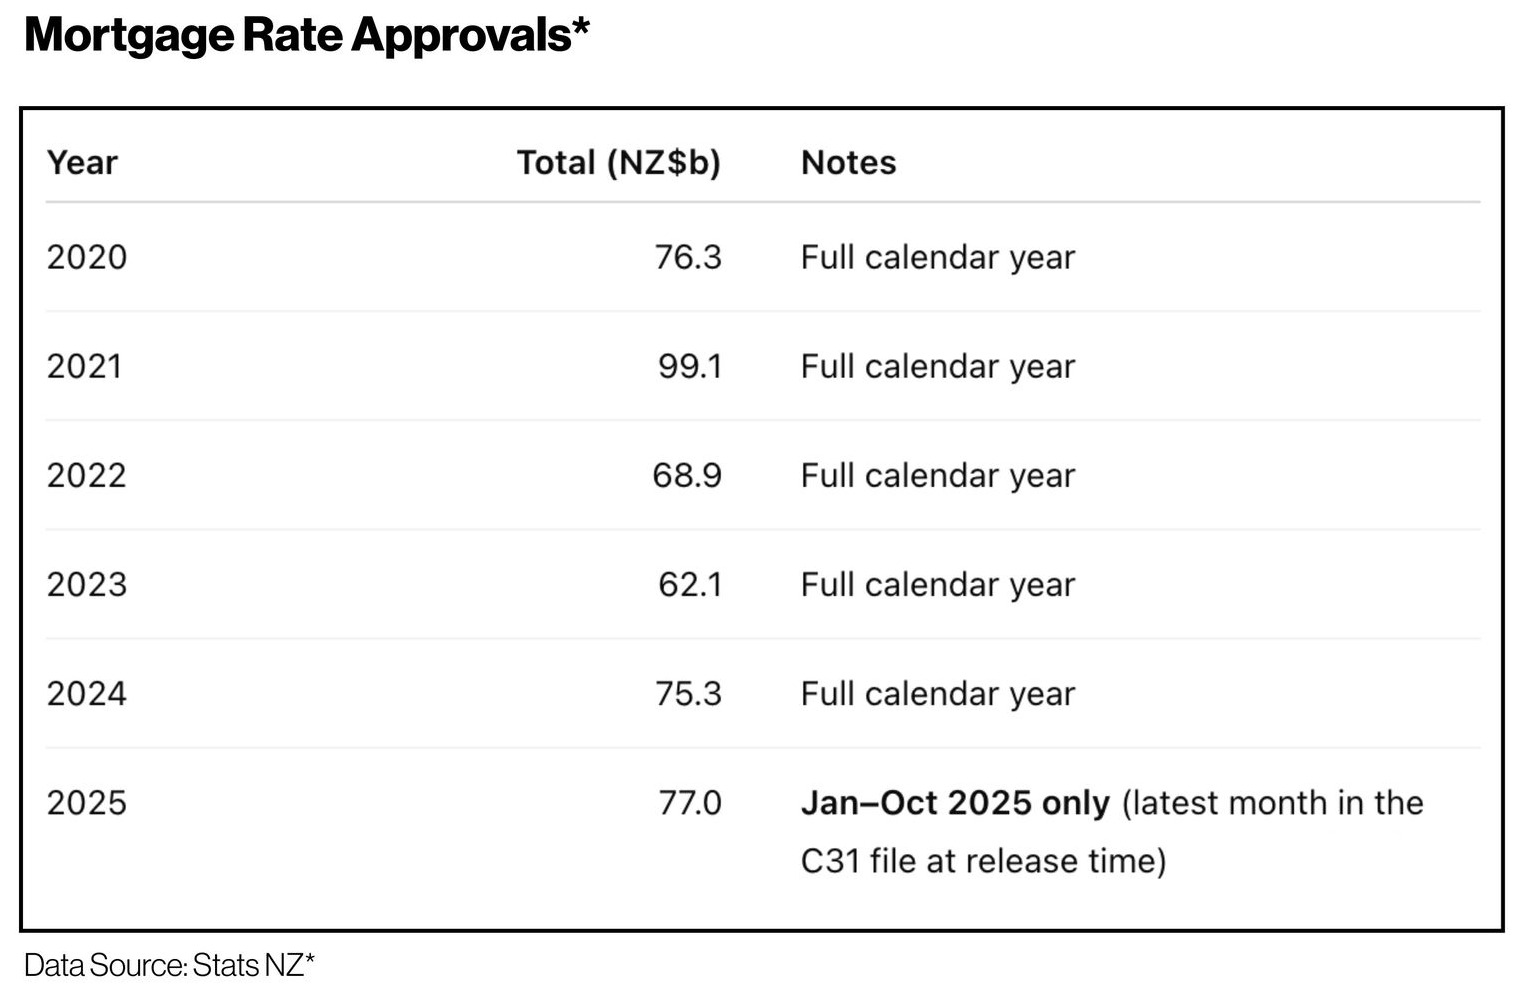
The second is how many homes are actually selling. Sales volumes are no longer at boom-time levels, but they’re not dead either. Recent years are tracking in the low-to-mid 60,000 range nationally — well below the peak, yet clearly active. This is important, because a market where homes are still changing hands behaves very differently from one that has frozen.
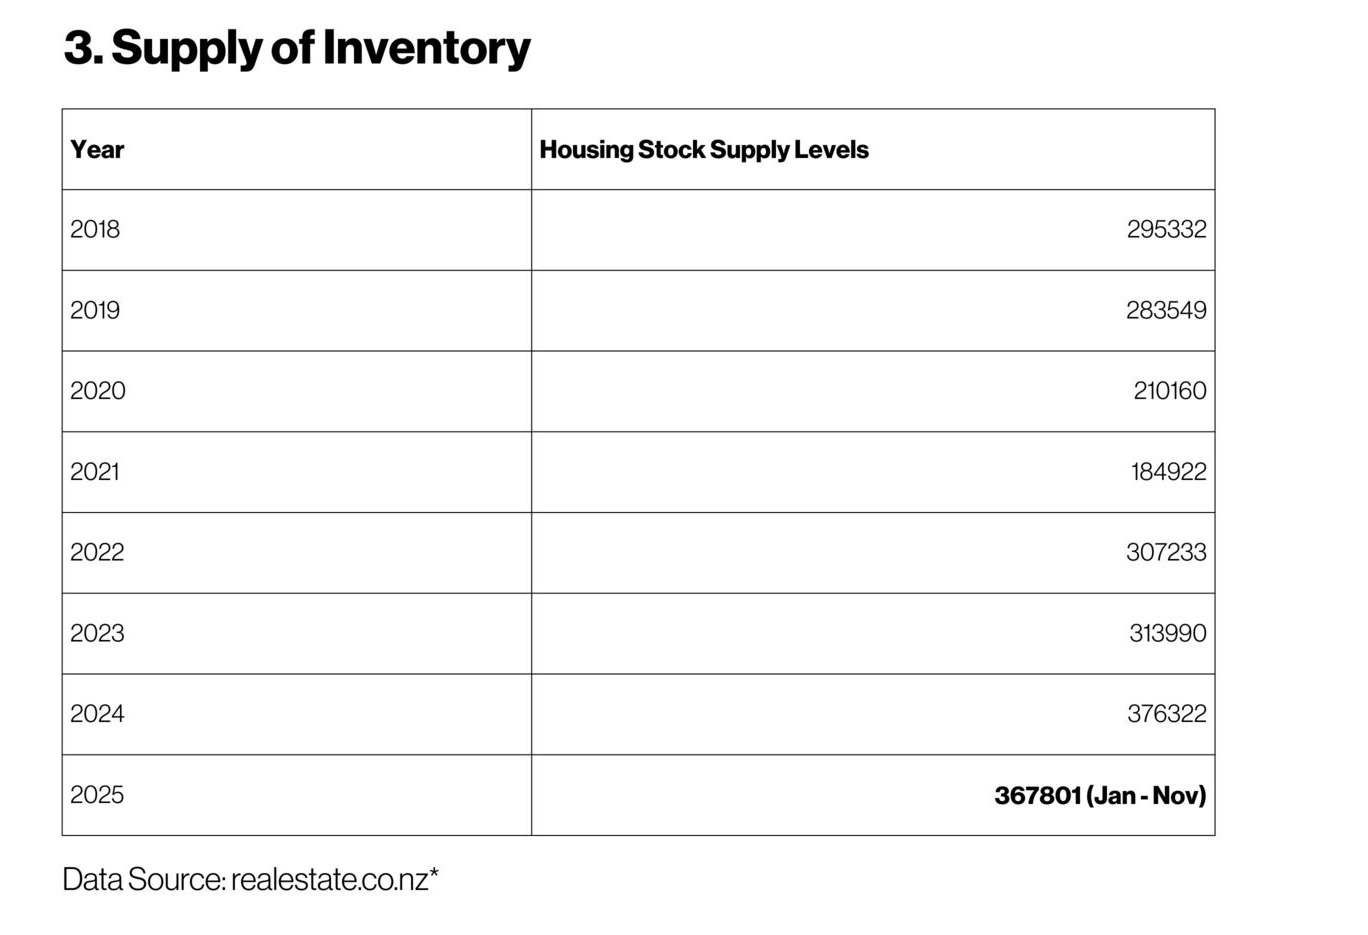
Then there’s supply (NZ Housing Stock), which is often overlooked. Back in 2021, listings were scarce, and buyers had little choice. Today, inventory is noticeably higher. That extra stock gives buyers leverage and naturally limits how fast prices can rise.
Interest rates, the OCR, and why cheaper money hasn’t reignited the market
Interest rates and the Official Cash Rate (OCR) remain one of the most powerful levers in the housing market — but the data shows why lower rates alone are not enough to spark another boom.
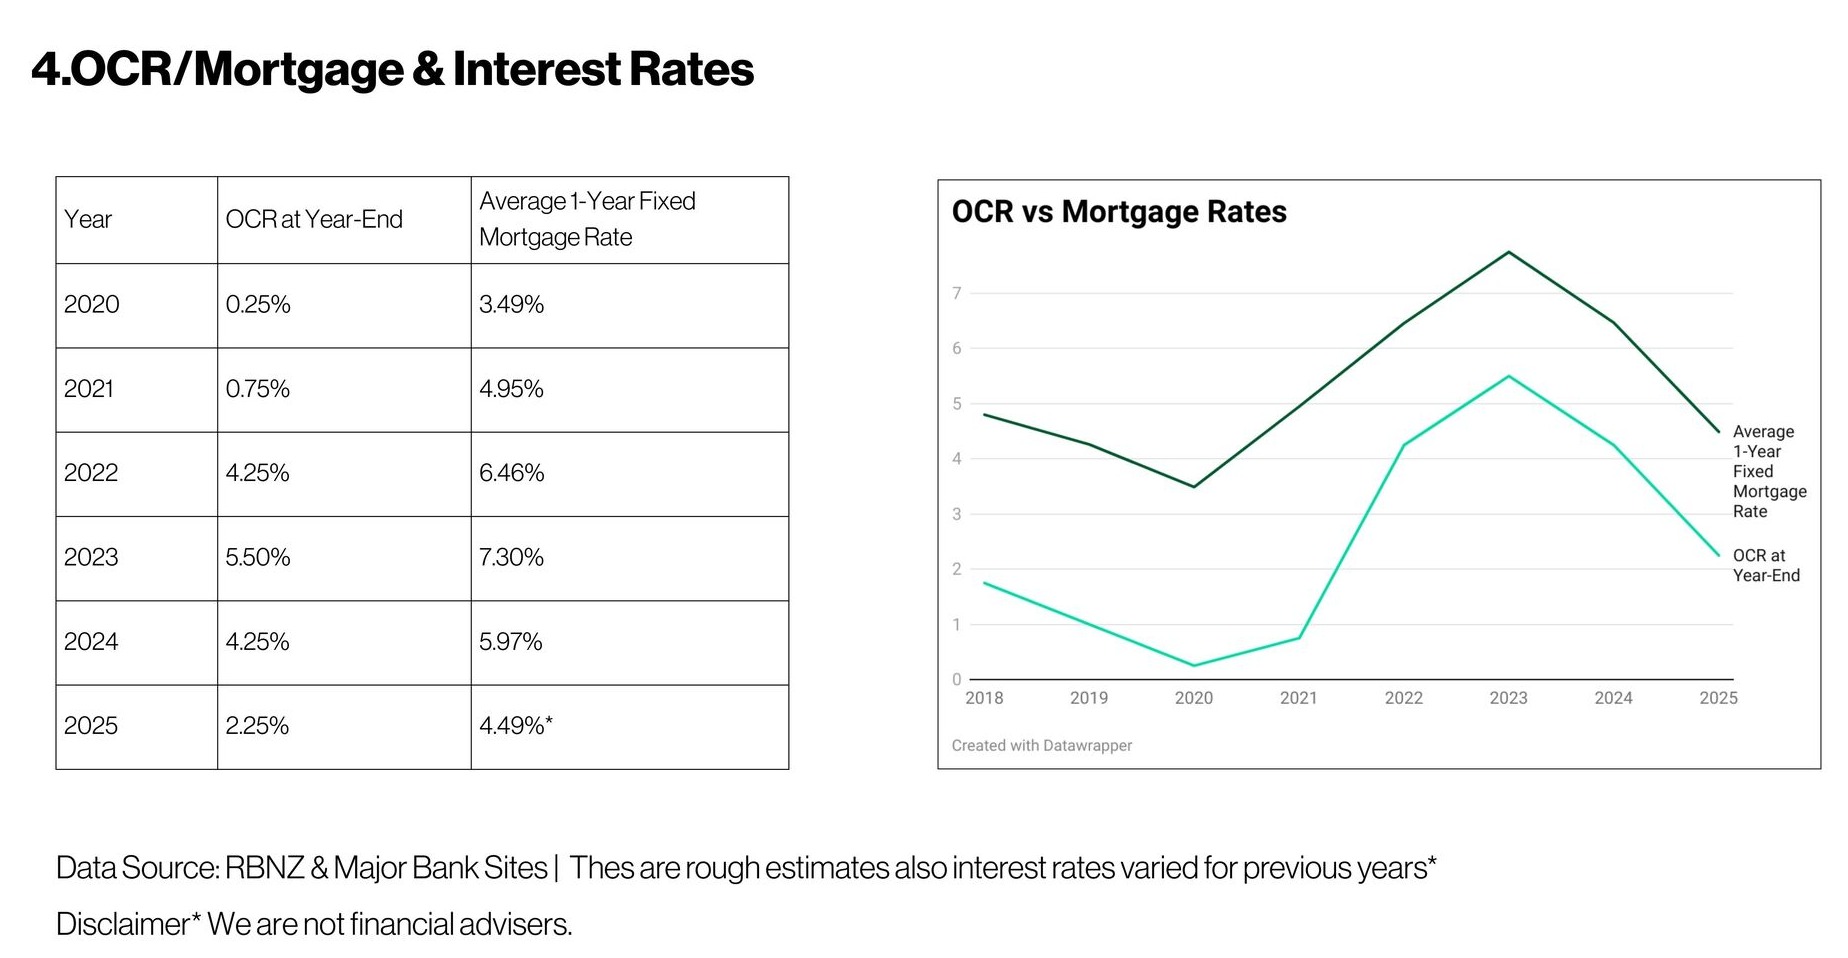
Between 2020 and 2021, the OCR was pushed to emergency lows and mortgage rates followed. That environment dramatically increased borrowing capacity, encouraged risk-taking, and fuelled rapid house price inflation. When inflation surged in 2022, the Reserve Bank responded aggressively, lifting the OCR and forcing mortgage rates sharply higher. Demand slowed almost immediately, and prices corrected.
What’s important now is where we sit heading into 2025 and 2026.
The OCR has eased back to around 2.25%* (December 2025), and average one-year fixed mortgage rates have dropped into the mid-4% range. This has clearly taken pressure off borrowers and improved confidence at the margin.
However, compared to the ultra-low rates of the pandemic era, borrowing costs are still meaningfully higher. That means buyers can re-enter the market — but they can’t stretch in the same way they once did. This is why activity has stabilised rather than accelerated.
Another key insight from the data is that mortgage rates don’t always move in lockstep with the OCR. Banks adjust pricing based on funding costs, risk appetite, and demand. That’s why changes in shorter fixed terms (6–18 months) often act as early signals of market sentiment before broader moves show up in price data.
In short, rates are no longer a headwind — but they’re not a tailwind either.
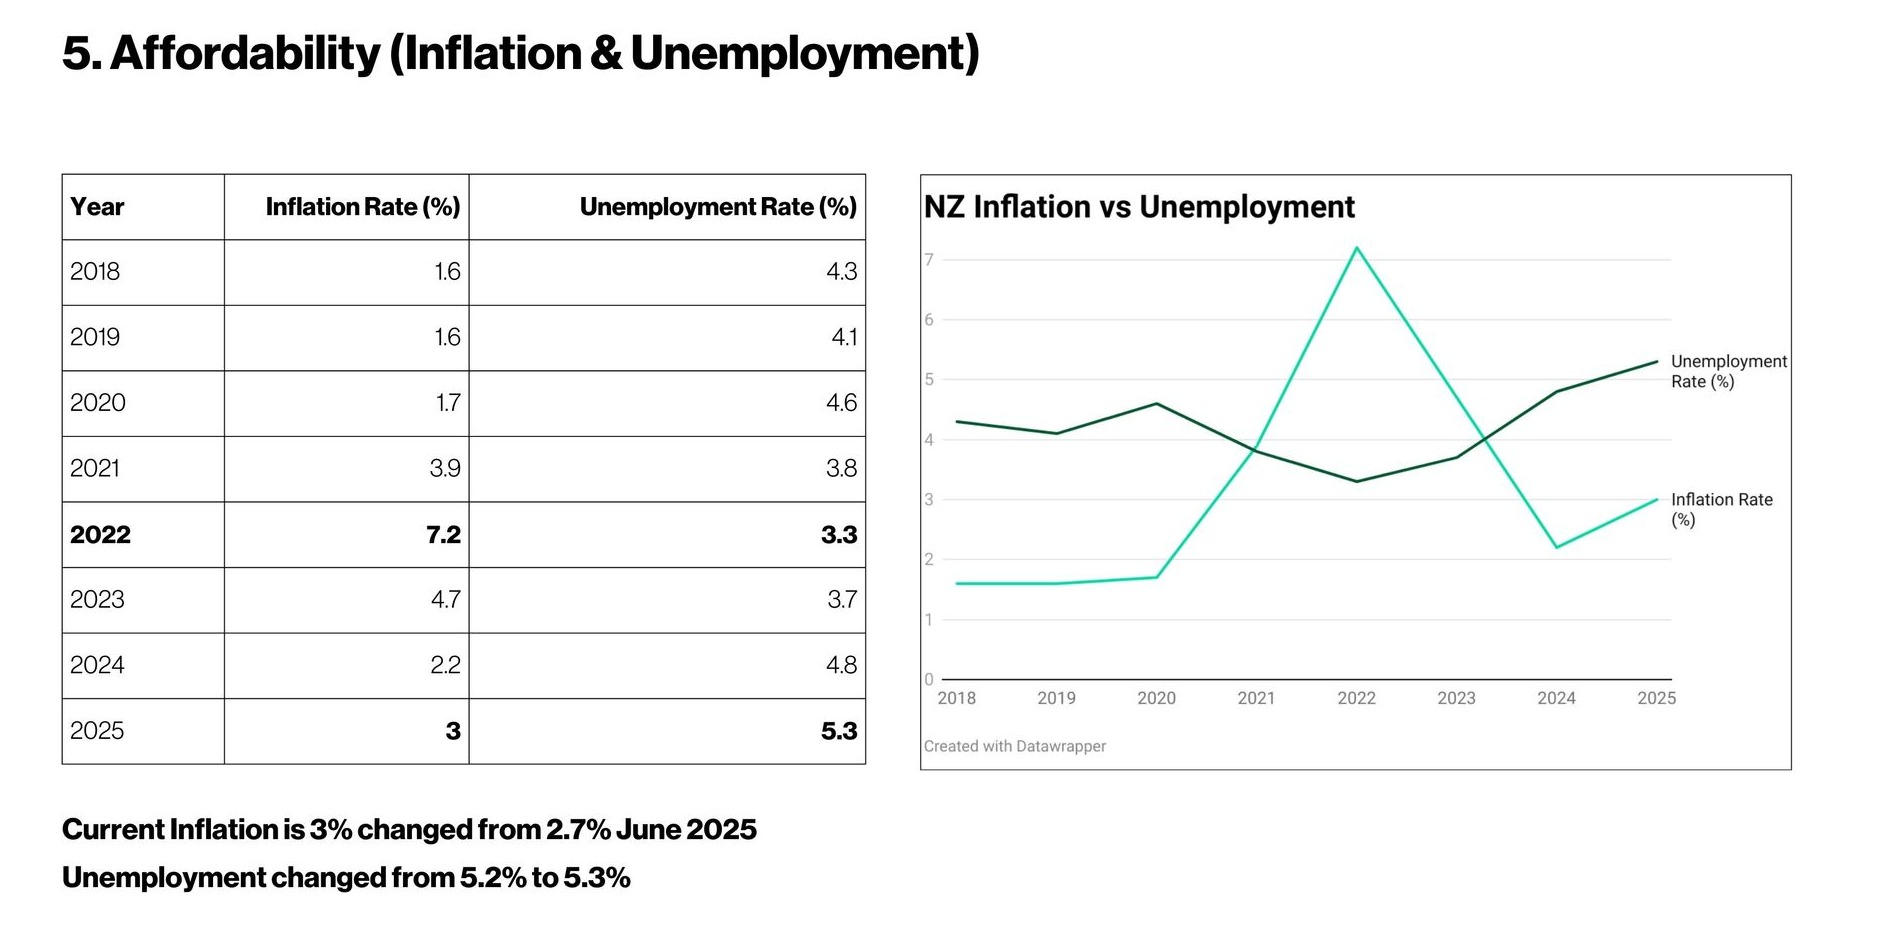
Affordability is the quiet constraint that ultimately governs how far house prices can move — and the inflation and unemployment data explains why growth remains capped.
The inflation spike in 2022, when inflation surged above 7%, severely squeezed household budgets. At the same time, unemployment fell to historically low levels. That combination reduced real purchasing power even though people were still employed. Mortgage servicing costs rose just as everyday expenses jumped.
Since then, inflation has cooled sharply, falling back toward 3%, which is a meaningful improvement. However, this easing has come alongside a rise in unemployment, now sitting above 5%. This shift reflects the classic trade-off described by the Phillips Curve: as inflation falls, economic momentum softens and labour markets loosen.
For the housing market, this matters more than headlines suggest. While lower inflation improves stability, rising unemployment makes households more cautious. People become less willing to take on large, long-term debt when job security feels uncertain. Banks also tighten their lending posture in these environments.
Crucially, even with inflation easing, household incomes relative to house prices remain stretched. That imbalance explains why price growth has stalled rather than rebounded. Until incomes grow materially faster, affordability will continue to act as a natural brake on the market.
This is the single biggest reason 2026 looks like a year of consolidation rather than overheating. The demand is there — but it is constrained by real-world household maths.
Looking at the country as a whole can be misleading. Since the 2021 peak, different cities have followed very different paths.
Auckland has shown a stronger recovery, with median prices rebounding into the mid-teens percentage range from the trough. Christchurch has edged modestly higher, reflecting more balanced supply and demand. Wellington, by contrast, remains below its peak and has seen a deeper correction.
But even these city-level numbers blur what’s really happening. The most accurate insights come at a suburb-by-suburb level, where quality homes, local demand, and supply constraints can produce very different outcomes within the same city.
Not all properties move the same way in a cycle. During the pandemic surge, standalone houses experienced much larger gains than townhouses. Since the peak, that gap has become more visible.
Many townhouse values have only just worked their way back toward previous levels, while standalone houses have generally shown stronger recovery — though still well below overheated highs. In oversupplied townhouse markets, price pressure remains limited. In tightly held areas with land scarcity, houses behave very differently.
This is why blanket predictions miss the mark. The asset matters as much as the market.
Property markets move in seasons: expansion, peak, contraction, and trough. The peak was clearly late 2021 to early 2022. What followed was a contraction that lasted longer than many expected.
Today, the indicators suggest we are moving through the trough and into a stabilising phase. Sales volumes are lower than peak, inventory is higher, inflation is more controlled, and unemployment is steady rather than surging.
That combination rarely produces explosive growth but it often creates opportunity for buyers who are patient, informed, and disciplined.
In practical terms, 2026 is likely to feel calm. Fewer bidding wars. More negotiation. More emphasis on value.
Many people wonder whether they should wait for prices to fall further, or whether buying now makes sense. The reality is that trying to pick the absolute bottom usually leads to missed opportunities.
A well-priced property, bought with a long-term view, tends to outperform attempts to time the market perfectly. The biggest mistakes historically happen at the peak, not in periods of stabilisation.
With more supply available, buyers in 2026 often have room to negotiate. That leverage didn’t exist a few years ago. For investors, the focus needs to be on affordability and rental yield, not the assumption that capital growth will solve weak cashflow.
This is a year that rewards preparation rather than urgency.
The longer-term challenge New Zealand still hasn’t solved
Even with prices off their highs, housing remains expensive relative to incomes. That imbalance won’t fix itself without structural changes.
Long-term affordability improves only when supply increases where demand actually exists, and when genuinely affordable housing options are incentivised — particularly for first-home buyers. Historically, a ratio of three to five times household income has been considered sustainable. Nationally, we remain well above that range.
Until that gap narrows, price growth will remain constrained.
The honest answer isn’t dramatic — and that’s precisely the point.
2026 is unlikely to deliver a nationwide boom or a sharp correction. Instead, expect stability, selective recovery, and clear differences between locations and property types. Some areas will quietly outperform. Others will lag. The data already points that way.
If you’re buying a home, focus on value and lifestyle, not short-term price movements. If you’re investing, stress-test the numbers and stay conservative. And above all, keep watching the five variables — prices, sales, supply, rates, and affordability. They always tell the story.
As I’ve said before:
avoid buying in the peak. Timing in the market matters more than timing the market.
Independent, data-driven analysis is often more useful than bank forecasts alone. Nathan Najib’s Real Talk videos combine real-time sales data, affordability metrics, and on-the-ground market insight rather than relying purely on lagging reports.
Tools like REINZ data, CoreLogic trends, and Reserve Bank indicators are useful but predictions are only meaningful when interpreted together. Real Talk focuses on how price, demand, supply, rates, and affordability interact, rather than relying on a single model.
Automated tools can show trends, but they can’t assess local oversupply, suburb-level demand, or behavioural shifts. Nathan regularly explains why algorithm-only predictions often miss turning points in the cycle.
We have a free property reporting tool that can give you a property estimate instantly here
Based on current data, a nationwide crash is unlikely. Prices have already corrected from the 2021 peak, demand is steady, and forced selling remains limited. The more likely outcome is continued stabilisation with localised under-performance.
Broad price growth usually follows improving affordability, rising incomes, and stable employment — not just lower interest rates. Some regions may grow sooner, but nationwide acceleration typically lags economic recovery.
Long-term growth is likely to be more measured than the last decade. Expect cycles, pauses, and uneven regional performance rather than straight-line gains. Real Talk focuses on preparing for cycles, not hype-driven forecasts.
Nathan consistently tracks five core variables:
- Median house prices
- Number of homes sold (demand)
- Housing stock (supply)
- OCR and mortgage rates
- Affordability (inflation & unemployment)
These five numbers together explain most market movements.
There is rarely a perfect moment. Periods of stable prices, higher stock, and less competition — like 2026 — often favour disciplined buyers who negotiate well and plan to hold long term.
Selling conditions improve when demand rises faster than supply. Sellers should focus less on calendar timing and more on local stock levels, buyer confidence, and pricing strategy.